Understanding ODELO
Footy
ODELO
Introduction
Explainer
An introduction to the model I use to make predictions

Welcome to Holy Grail Ratings. This is a project of mine to try and model AFL margins as best as possible. This post explains how the model currently works, why I’ve made particular choices, and planned future improvements.
The Importance of Scoring Shots
To introduce my model for AFL margins consider one question - what is the principal component of a football game’s margin? If you asked head coaches you’d probably get a variety of answers reflecting gameplan - maybe pressure rating, uncontested marks, handball/kick ratio.
My model takes a simpler view which relies on a heuristic observation about AFL, an average game has an extremely high number of interactions. A key result? Events at the extremes tend to cancel each other, for every goal conceded from an intercepted kick-in there’s a set shot from a questionable free kick.
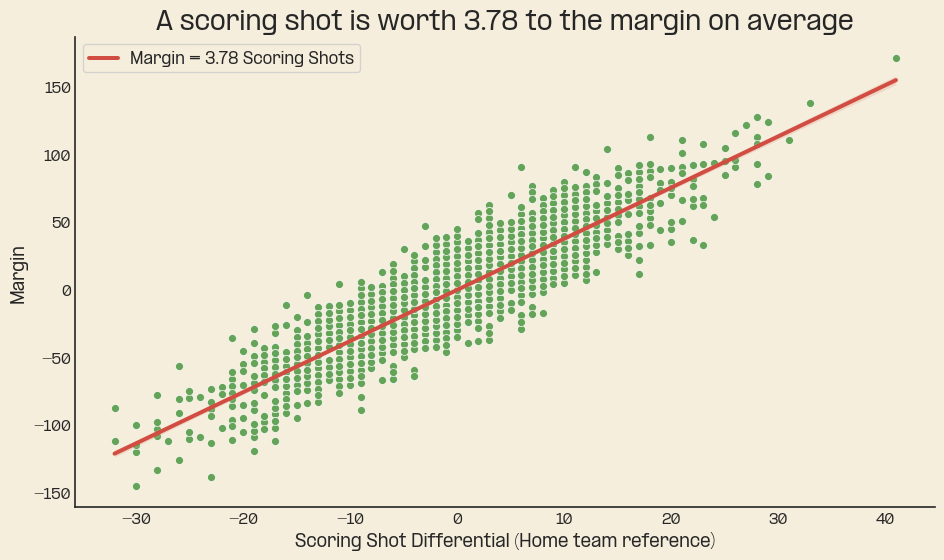
The implication for AFL is that scoring is relatively stable, extreme events tend to have a minimal effect on the final margin. What matters most then? – scoring shots, any attempt on goal, whether a major, behind or clanger 1.
Here is a graph of every margin in comparison to the scoring shot differential, highlighting the average contribution of a scoring shot to the margin.
A logical question is, what about accuracy? Are the best teams more accurate and the worst more inaccurate, could good - more accurate - teams overcome scoring shot differentials? Surprisingly, teams good or bad rarely manage to outperform or underperform compared to the league average scoring shot conversion. This graph shows each teams conversion rate since 2014.
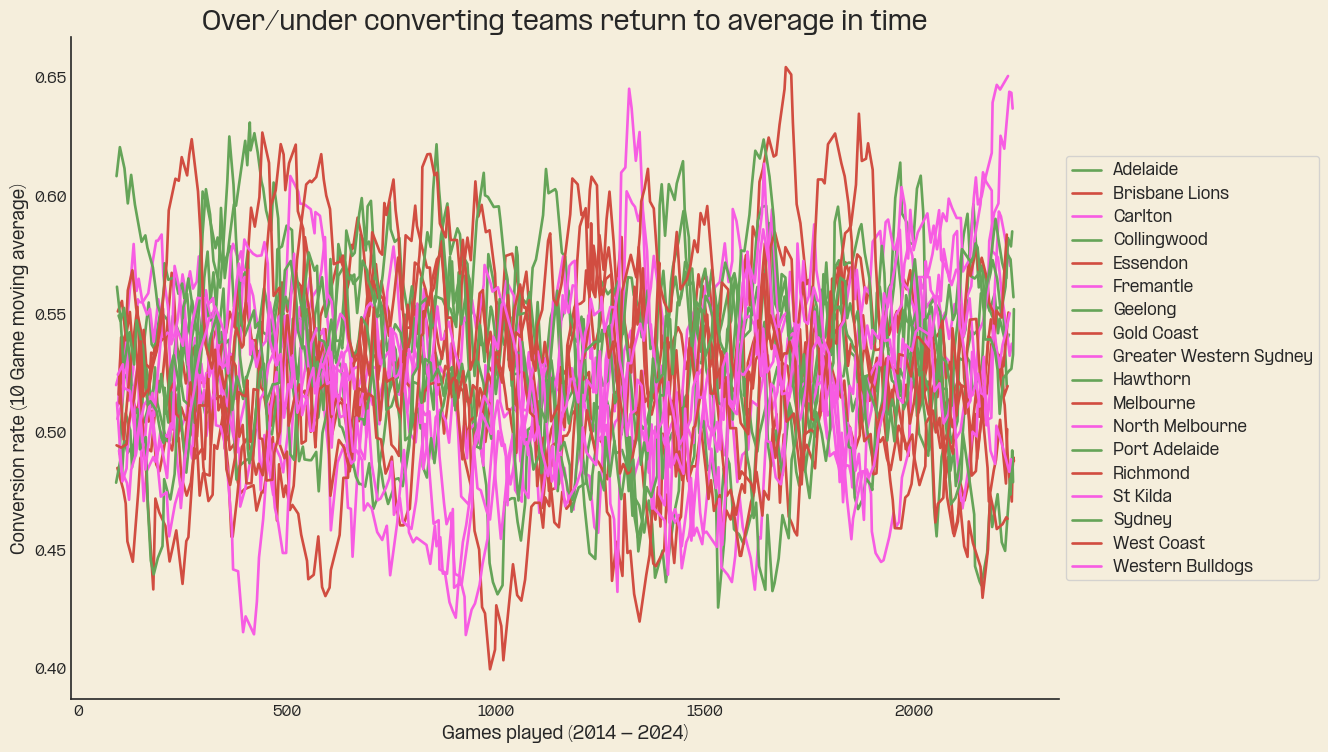
The key takeaway from this graph is the only short term minor deviations from the all time conversion average rate of 53%. In the data the absolute best conversion rate is around 60% and the worst around 40%. The value of a scoring shot at each rate respectively is 4.6 and 3.4, the difference being just 1.2. This means to win the absolute best converting team would require at least 2 shots for every 3 their terribly converting opponent registers. The point being even if a team converted extraordinarily well and their opponent woefully it is extremely hard to overcome scoring shot differentials.
It is true however that certain shots are better than others, shots from the goal square vs centre square will have wildly different conversion rates. Thus XScore, in my model I use an excellent calculation by AFLLab which weights the value of a shot in comparison to the historical conversion rate based on its location.2 These facts about scoring shots provide the methodology for rating teams’ abiltiies in my model.
ODELO Explainer
ODELO (Offensive and Defensive Elo) is the model I use to generate team ratings. A team has two ratings, offensive and defensive, measured as the number of points better than the league average number of scoring shots converted at the average rate. Ratings in this form give us an idea of the relative strengths of teams and allows a simple comparison across teams.
They also can be easily turned into predictions of the margin by comparing the number of points better an offense is than its opposing defence. To convert to margins, the amount the home offense will outscore the away defense is calculated, the defensive margin is calculated similarly and the final expected margin is their sum divided by 2.
\[ \text{Expected Home Offensive Margin} = \text{Home Team Offensive Rating} - \text{Away Team Defensive Rating} \] \[ \text{Expected Home Defensive Margin} = \text{Home Team Defensive Rating} - \text{Away Team Offensive Rating} \] \[ \text{Expected Home Margin} = \frac{\text{Expected Home Offensive Margin} + \text{Expected Home Defensive Margin}}{2} \]
ODELO is an Elo system where the predicted margin is used to assess a team’s actual performance and adjust their ratings. Elo systems were developed for chess, and are a well-known technique for assessing the relative strength of teams and players in different sports. The trick to Elo systems is updating ratings, in chess two players ratings are updated after the game using this formula,
\[ \text{New Rating} = \text{Old Rating} + K(\text{Expected Performance} - \text{Actual Performance}) \]
In chess, Elo ratings are arbitrarily set such that an average player has a rating of 1500 and scaled so that a 200 point rating difference translates to a 75% win probability. In ODELO the ratings represent how many points a team is better/worse than the average score, and I have fit my own win probability function.
To update ODELO ratings, I have a slightly modified formula, with several parameters. The formulas simply adjust a teams rating by the amount they outperform the average score,
\[ \text{New Offensive Rating} = \text{Old Offensive Rating} + K(\text{Home Expected Score} - \text{Average Score}) \] \[ \text{New Defensive Rating} = \text{Old Defensive Rating} + K(\text{Average Score} - \text{Away Expected Score}) \]
There are three parameters in the calculation I have optimised for, 1. K-factor 2. Regression to mean 3. Days to Average
K-factor
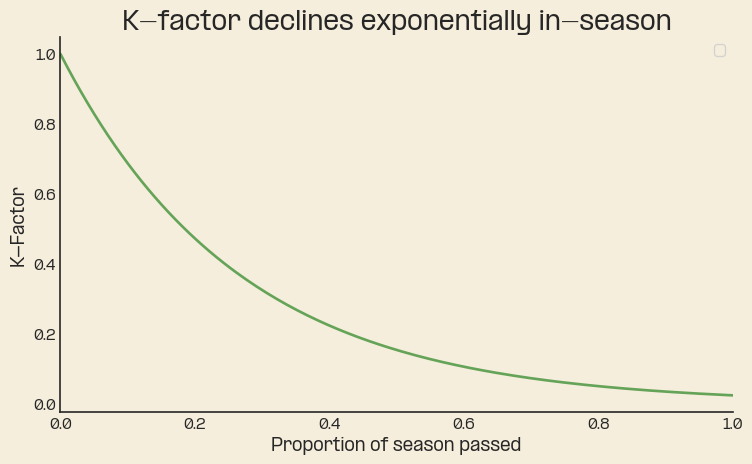
K-factor weights a team’s actual performance compared to their expected performance and determines the size of rating changes. I use an exponentially decaying K-factor dependent on the proportion of the season passed. This reflects some obvious observations about AFL, early in the season there’s not much known about a team’s ability, there’s likely personnel change, game plan change, aging, so significant change in their rating is expected.
Similarly, towards the end of the season there is more certainty around a team’s ability, the prevalence of dead rubber games in the last few rounds also gives reason to move ratings less.
Currently I have lazily optimised K-factor by finding an exponential co-efficient which minimises error but is an area for improvement. The progression of the K-facotr looks like this,
Regression to mean
To account for inter-season effects, it is helpful to shift teams back towards the mean, this accounts well for several small effects which are hard to quantify on their own but clearly have an effect on the game, for example teams which finish a season on a hot run tend to come back to reality as other teams study their gameplan.
Teams offensive and defensive ratings are regressed 30% in between seasons, which is a simple brute force optimisation, and reduces error significantly.
Days to average
This is a simple measure to account for long term changes in the average score, the average score of AFL is relatively stable, with no major short term variations with the exception of the COVID-19 afflicted 2020 season.
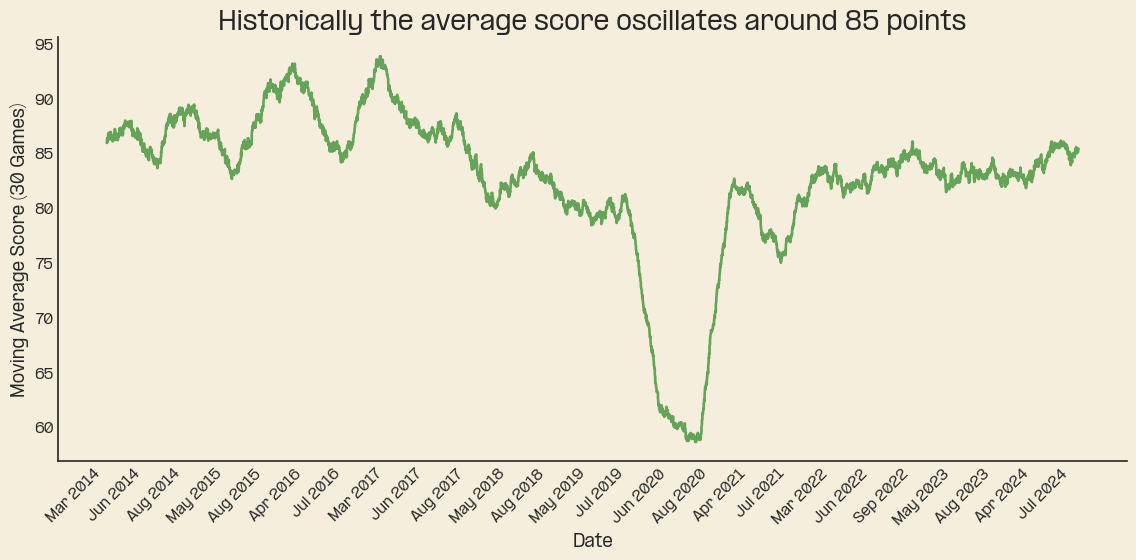
Average score mainly oscillates around 85, the variation in terms of scoring shots is relatively small worth around 3 scoring shots so I’m not concerned about using the average in the model.
The days to average window used to determine the average score is optimised to account for any long term systemic trends. This comes out to about 5 years.
Win Probability
I mentioned earlier that chess uses a set formula to convert Elo ratings into implied win probabilities, so does ODELO. I have fit a logistic regression using historical margins and the ODELO predicted margins, this returns a sigmoid coefficient. To determine win probability I use the sigmoid function as a function of the expected margin. \[ \text{Win probability} = \frac{1}{e^{-k * \text{Expected Margin}}} \]
Plotting this function gives a graph showing the relationship between expected margin and win probability in ODELO.
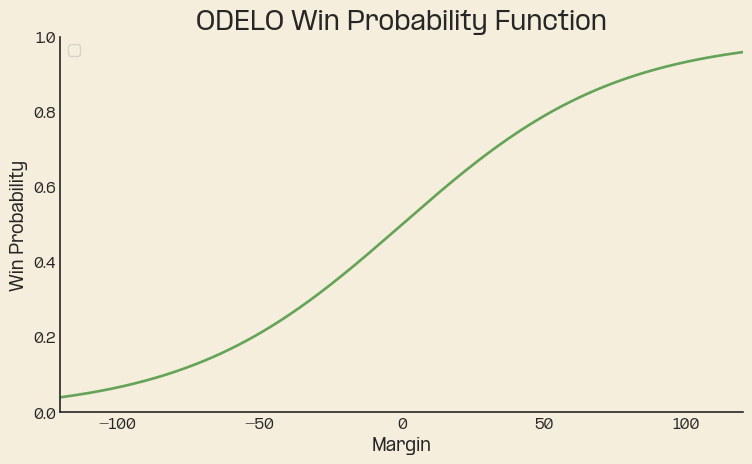
This is how win probabilities are calculated each week on the homepage.
Performance
Back testing with these parameters ODELO has a mean absolute error3 of 28.8 over 2014 – 2024. This is fairly solid given there are a number of simple improvements to be made. However in comparison with other models on Squiggle where the best models tend to have an error of 22 - 27 depending on the year, there is plenty of room for improvement in ODELO.
Future Improvements
ODELO remains fairly crude, and I have a few improvements to work on. Most obvious is an estimate of home ground advantage, I’ve done some early research on this and plan to write a future post on it. Improving optimisation is another goal, K-factor being the main offender, given its importance to weightings I suspect any improvement will significantly improve performance. Asides from these two I have some other ideas to investigate,
- A bye adjustment and more broadly a measure to account for differing amounts of rest between teams
- A player based model to blend with ODELO to account for injuries and individual contributions
- Optimising win probability based on expected total score4
- Various adjustments about team performance in finals
- Determine a weighting of XScore and true score, some amount of true score probably reflects a team’s ability to get good shots or perform under pressure.
These are a few of the big things that I’m planning to add into the model which will probably take some time but are nonetheless achievable. Hopefully this gave some insight into how the predictions displayed on the home page are calculated and what exactly they represent.
Data
In case you’re interested in how I manage the data for the model and the sources used. I have an SQL database which I populate with data sourced in python using the fitzRoypy wrapper for the [fitzRoy] (https://jimmyday12.github.io/fitzRoy) API. I draw data from a few sources for forecasting but for optimising to historical data I use game data from Squiggle. I’ve also experimented with historical betting data as a way to measure error, this [dataset] (https://www.aussportsbetting.com/data/historical-afl-results-and-odds-data) is the best source I’ve been able to find but I’m on the hunt for more.
Footnotes
I’ve taken this scoring shots terminology from Matter of Stats.↩︎
MAE measures the absolute prediction difference. If the expected margin is 12 and the final score is 24 or 0 the MAE is 12 in each case. This measure is chosen because ODELO is optimised for margin prediction.↩︎
This article explains the observed correlation between win probability and expected margin and totals.↩︎